ExDeploy 日志(或称部署序列日志)记录了在远程目标上安装和启动组件时执行的指令,是诊断 exOS 目标部署序列的主要手段。所有日志条目均由系统生成。如果出现无法使用所提供的[功能块][fbks_main]进行诊断的应用程序错误,该日志记录器就会非常有用。
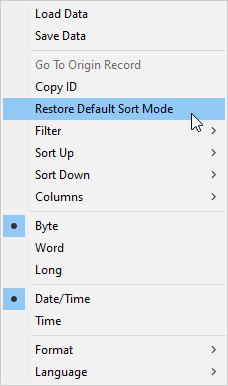
使用 exOS 中的任何日志记录器时,建议始终选择 "默认排序模式",因为某些日志记录器条目可能具有相同的时间戳(即发生在同一时间)。使用 "默认排序模式 "后,这些条目将按照正确的顺序排列。
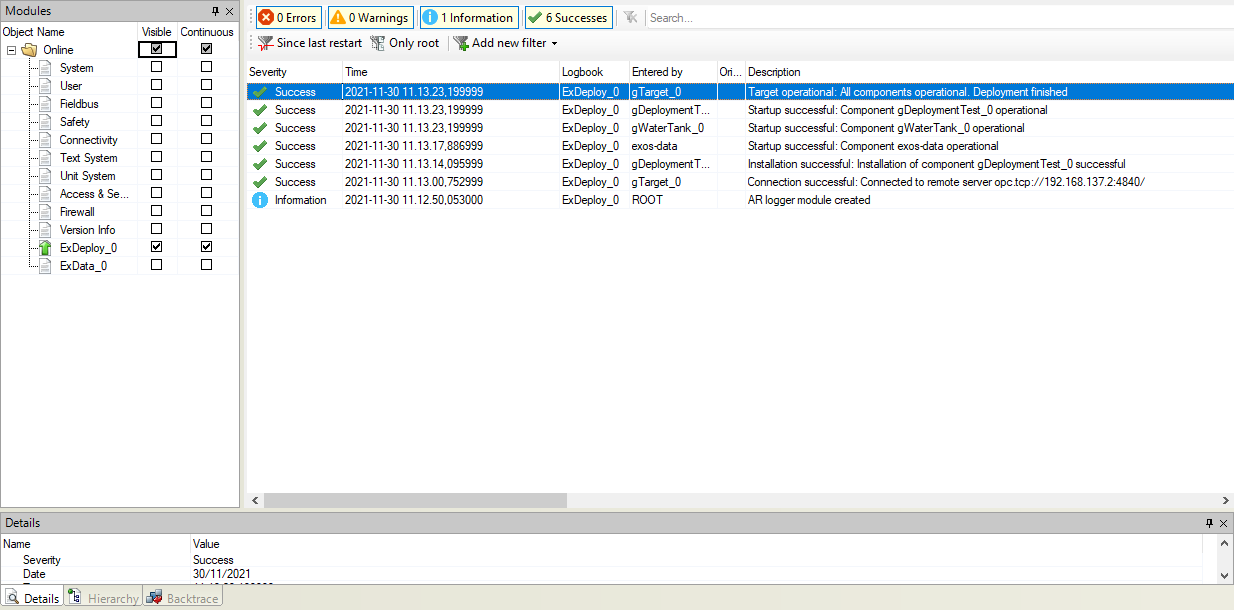
默认情况下, exostarget的日志级别 配置为 "成功"。这也是值得推荐的,因为它会显示所有错误和警告,以及系统是否成功完成了配置任务。
下面的截图显示了日志级别设置为 "成功"(默认)的配置输出:
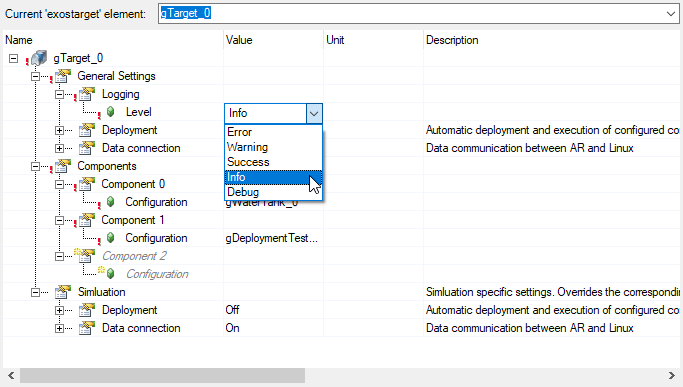
将日志级别更改为 "Info"(信息)时,日志记录器中会输入更多的冗长信息,如所有安装和启动服务的日志,以及基本的目标比较输出。
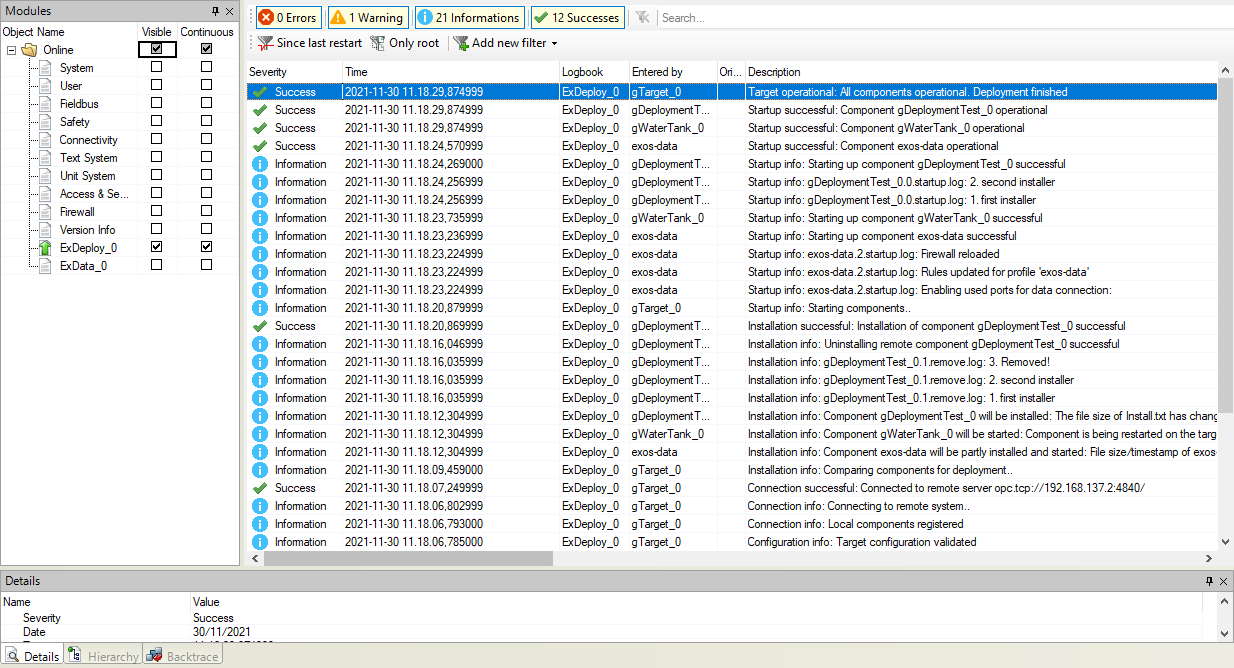
对于与之前相同的配置,记录仪级别 "Info "会显示以下输出:
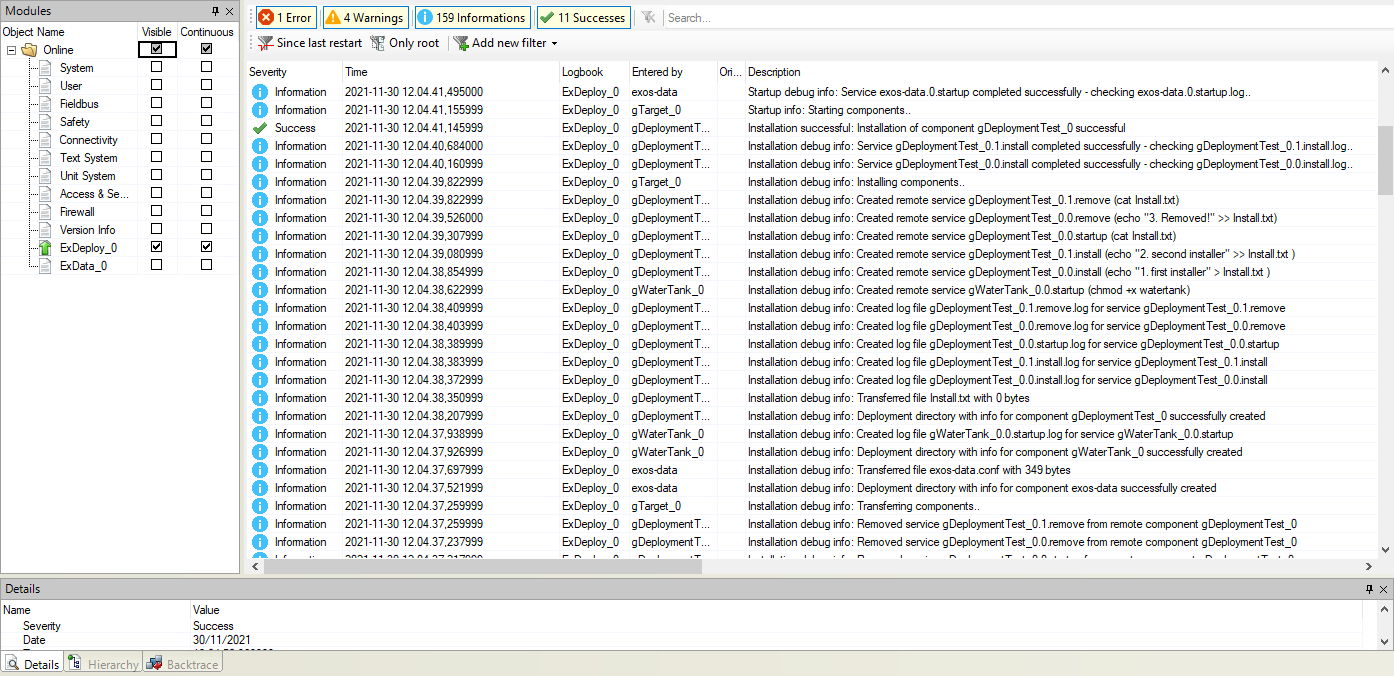
将相同设置更改为 "调试",将显示部署序列中的所有可用信息,如文件传输、添加和启动的服务,以及更详细的目标比较输出。
对于与之前相同的配置,日志记录器级别为 "调试 "时会显示以下输出:
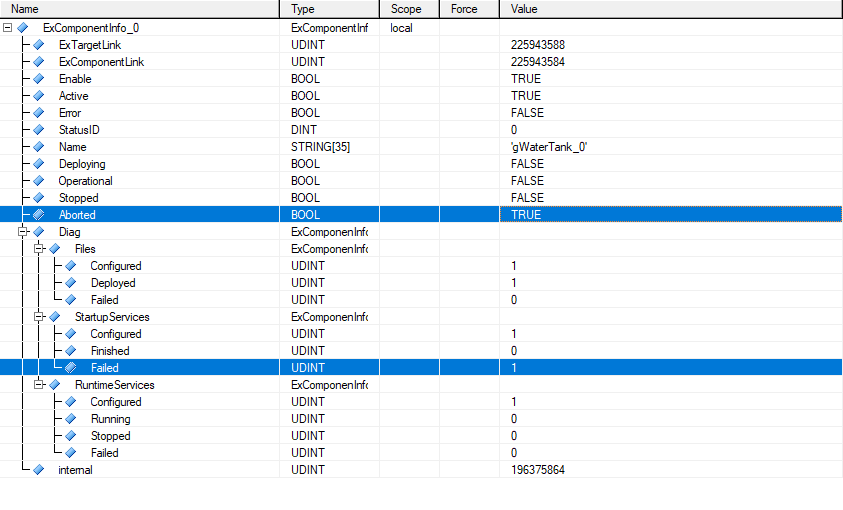
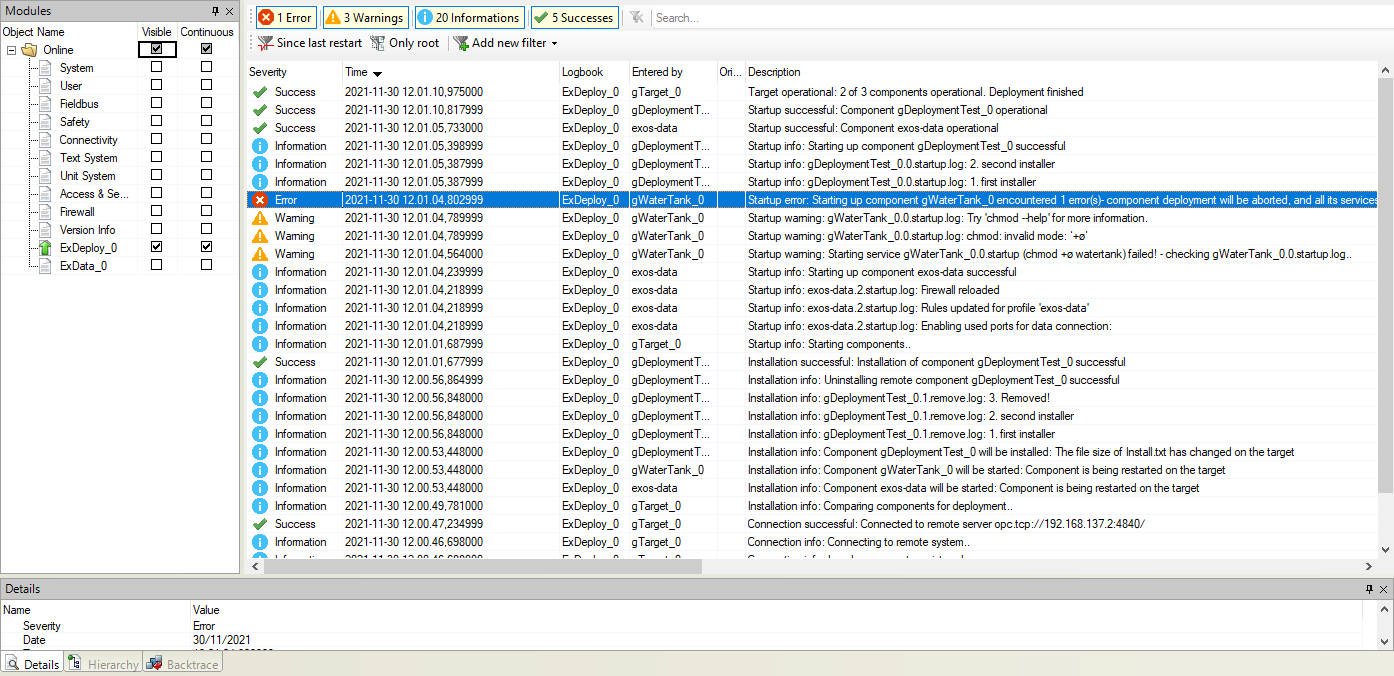
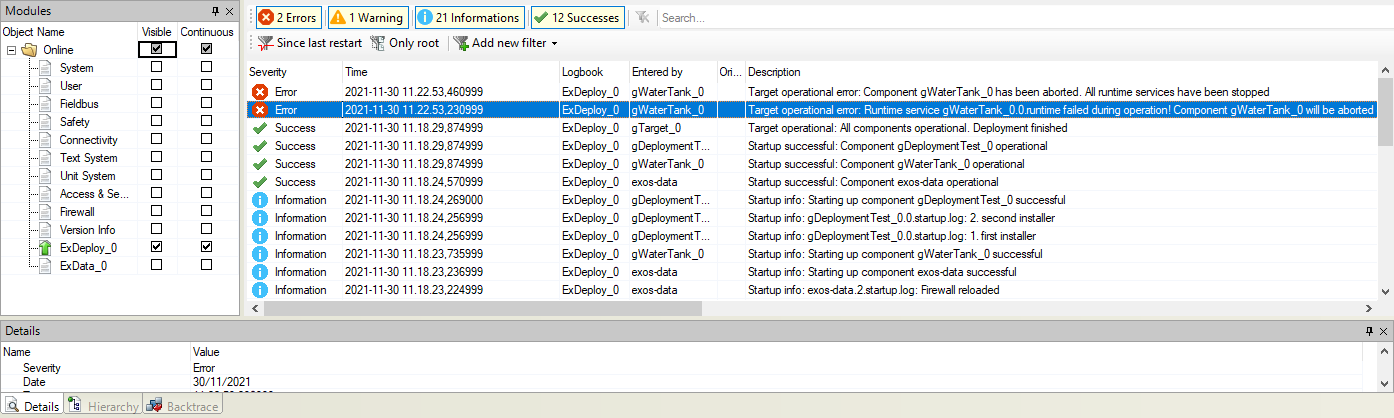
如果在组件部署过程中出现错误,可以通过 ExComponentInfo 或 ExTargetInfo 功能块 进行基本诊断 。在本例中, gWaterTank_0 组件 的 启动服务在运行过程中出现了问题 , 现在该组件已被 中止。
要想更详细地 了解启动服务 失败 的原因 ,ExDeploy 会在日志记录器中显示所有失败服务的输出,即使日志级别设置为成功。在这里我们可以看到,启动服务使用了无效的 chmod 命令 参数 。
部署完成后,部署管理器还会监控目标机上所有运行时服务的活动状态。如果某个运行时服务提前结束,也会 连同 进程 的stderr 输出 记录到日志中 (通常是脚本语言的异常或 C/C++ 程序的回溯)。在我们的例子中, 水箱 程序是在外部结束的:
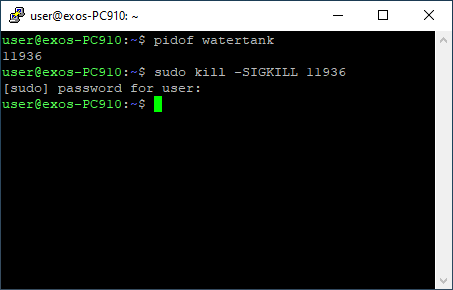
这意味着水箱不再有 stderr 输出(否则会在日志记录器中看到),并被关闭。在这种情况下, ExComponentInfo 也会 发出 运行服务失败的Aborted 信号 。
python 或 JavaScript 等脚本语言会向 stderr抛出异常 , 以防应用程序无法捕获这些异常。在这种情况下,脚本执行结束,异常会显示在日志中:
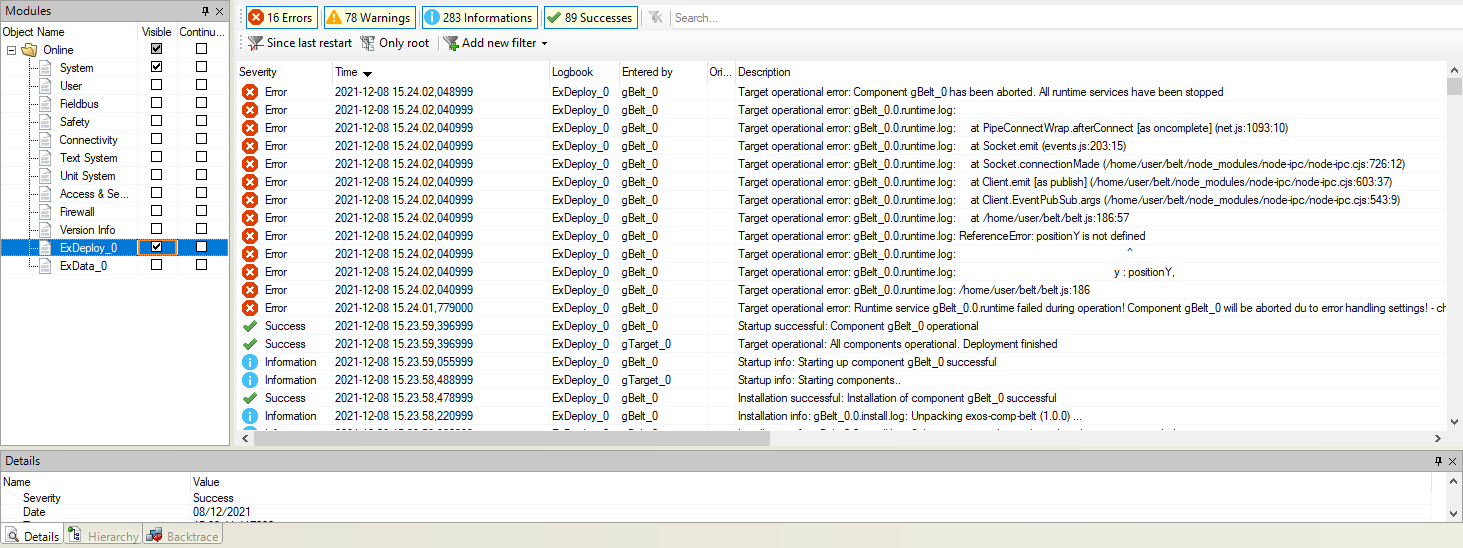
如果应用程序 在 结束前向 stderr输出了任何 信息,这些信息将显示在日志记录器中 。 在下面的示例中,堆栈跟踪被捕获,并 通过 SIGSEGV 信号 转发到 stderr。
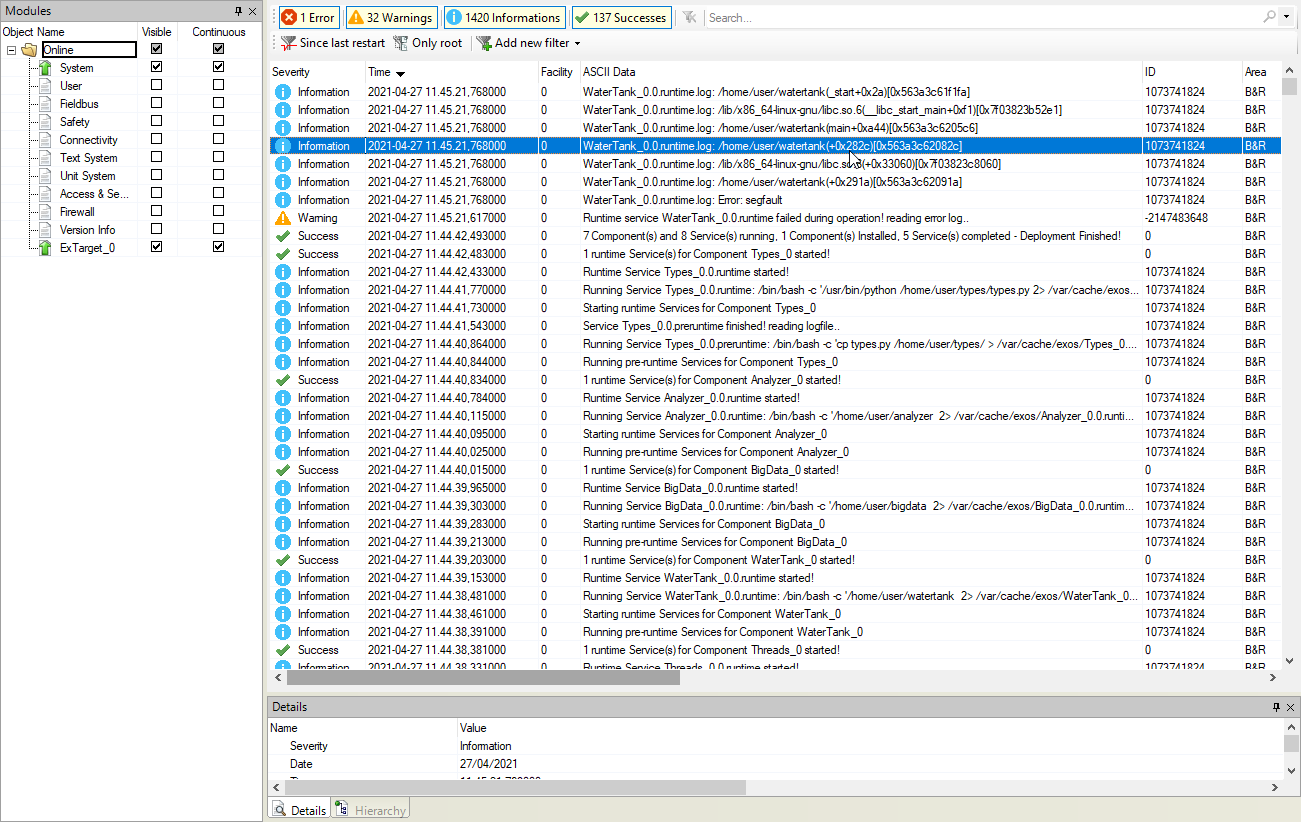
在这种情况下, 可以使用addr2line 函数获取发生页面故障的行
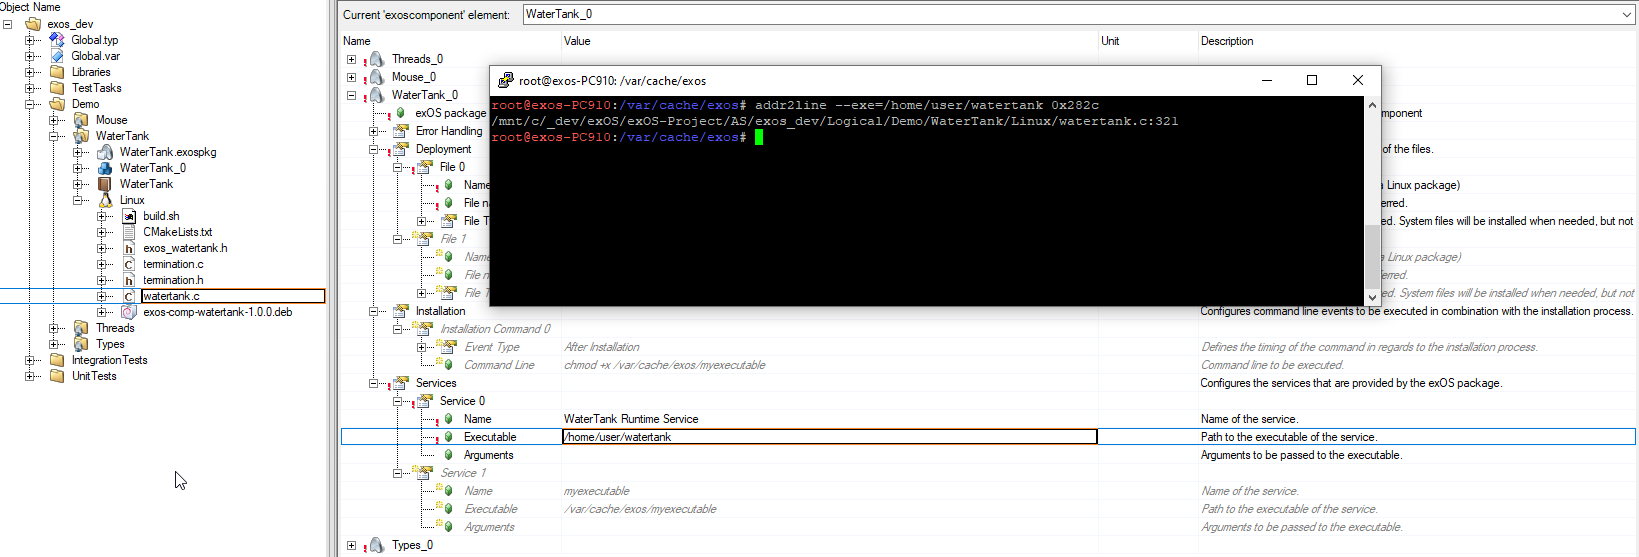
有了这些信息,就能找到代码中引发分段故障的位置
The ExDeploy logger - or or deployment sequence log - records the instructions that are carried out in combination with installing and starting components on a remote target, and is the primary means of diagnosing an exOS target deployment sequence. All log entries are generated by the system. This logger can be useful if application errors occur that cannot be diangosed using the provided [function blocks][fbks_main].
Using the ExDeploy logger
When using any of the loggers in exOS, it is recommended to always select the "Default Sort Mode", as some of the logger entries can have the same timestamp (i.e. take place at the same time). With the "Default Sort Mode", these entries are placed in the correct order.
Logger levels
By default, the log level in exostarget is configured to "Success". This is also recommended, because it will show all errors and warnings, and if the system in overall was successful with completing the configured tasks.
The following screenshot shows the output of a configuration, where the log level is set to "Success" (default):
When changing the log level to "Info", more verbose information is entered in the Logger, like the logs from all installation and startup services, and basic target comparison output.
For the same configuration as before, the logger level "Info" shows the following output:
Changing the same setting to "Debug" will show all available information from the deployment sequence, like file transfers, services added and started, and more verbose target comparison output.
For the same configuration as before, the logger level "Debug" shows the following output:
Deployment errors
If there is an error during deployment of a component, the basic diagnostics can be done via the ExComponentInfo or ExTargetInfo function blocks. In this example, there was a problem with running a startup service of the gWaterTank_0 component, and that this component is now Aborted.
For a more detailed information regarding why this startupservice failed, ExDeploy will show the output from all services that failed in the Logger, even if the log level is set to success. We can see here, that the startup service used an invalid parameter for the chmod command.
Runtime errors
The deployment manager also monitors the active state of all runtime services on the target after deployment has been finished. If a runtime service should end prematurely, this is also entered in the logger, together with the stderr output of the process (this is normally an exception in case of a scripting language or a backtrace from a C/C++ program). In our case, the watertank program was killed externally:
This means the watertank has no further stderr output (that would otherwise be seen in the logger), and is shutdown. In this case, the ExComponentInfo will also signal Aborted with a runtime service failure.
Exceptions
Scripting languages like python or JavaScript throw exceptions to stderr in case these are not caught in the application. In this case, the script execution ends and the exception is displayed in the logger:
Segmentation faults
In case applications output anything on the stderr before ending, this information is displayed in the logger. In the following example, the stacktrace is caught and forwarded to the stderr on the SIGSEGV signal.
In this case, the addr2line function can be used to obtain the line where the page fault took place
With this information, the position in the code can be found which triggered the segmentation fault